Volcanic gases from Kilauea are
analyzed using a mass spectrometer
at the Hawaiian Volcano Observatory
There are three primary ways that gas geochemists collect data:
Scientists can determine the amount and types of gas in a rock, in the minerals within a rock, or in the gas inclusions in minerals or glass (Ihinger and others, 1994). The methods fall into four classes: bulk extraction, energetic particle bombardment, vibrational spectroscopic techniques, and phase equilibrium studies. These method are used in experimental studies and for rocks from all tectonic settings, historic eruptions, and large pre-historic eruptions. Some methods have been found to underestimate the observed amount of gas released during some historic eruption. Thus, the methods may give an estimate of the minimum amount of gas released. For example, Gerlach and McGee (1994) used melt inclusion data to estimate 0.08 Mt of SO2 emitted by the Mount St. Helens eruption. TOMS, COSPEC and ash leachate data provide an estimate of 2 Mt. Gerlach and McGee suggested a vapor phase carried most of the SO2.

The easiest, but often the most difficult, way to collect a sample is by hand, placing a container directly in the gases. This method was perfected by the late Werner Giggenbach. Difficulty arises because of the high temperatures, dangers associated with being close to vents, and the possibility of contamination of the sample by the atmosphere. Left diagram: Evacuated-bottle sampling scheme. Direct samples are most commonly collected in solution-filled bottles (4N NaOH in a titanium or silica tube) and then returned to the lab for analyses. In the drawing on the left, the enlargement shows an evacuated glass bottle. The solution contains NaOH and collected H20), H2S, SO2, HCl, HF, and CO2. The headspace contains collected H20, H2, CH4, O2, CO, N2, Ar, Ne. Right diagram: Flow-through sampling scheme. Figure from Sutton and others, 1992).

Right: Volcanic gases from Kilauea collected using the flow-through sampling scheme. Photo by Steve Mattox.
Another way to measure gases released by a volcano is to collect fresh ash samples (before it rains) and pour distilled water through the ash. Then after the liquid passes through the ash it is collected. This is the leachate. The leachate is analyzed for Cl (chloride), F, SO4 and pH. The ratio of Cl to S increases prior to eruptions.
Leachates were measured prior to the 1980 eruption at Mount St. Helens (Nehring and Johnston, 1981). Cl and SO4 were measured in the field and the S/Cl ratio was observed to increase gradually from March 28 to May 18.
The S/Cl ratio increased 30 times over its initial value prior to an eruption of Asama volcano in Japan. At Fuego, in Guatemala, the S/Cl ratio increased 5 times over its initial value and the size of the change was proportional to eruption size.
Continuous direct sampling is a relatively new method to monitor gases. Results of measurements are telemetered to safe locations off the volcano. At Mount St. Helens, upward-moving fresh magma was detected 12 to 60 hours before it was extruded into the dome (McKee and Sutton, 1994).
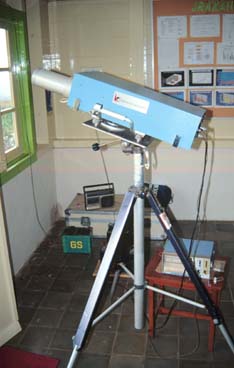
Volcanologist found an application for an instrument used to measure pollution. A correlation spectrometer (COSPEC) is designed to measure the amount of sulfur dioxide in a passing air mass (or volcanic plume). The spectrometer compares the amount of solar ultraviolet light absorbed by sulfur dioxide in the plume to an internal standard. Numerous measurements are made to achieve reliable results.

COSPEC used to measure SO2 released by Merapi Volcano.

Use of vehicle-mounted (left) and tripod-mounted (right) ground-based COSPEC.
A. Side view. B. Front view. C. Typical data. From Sutton and others (1992).
Balloons are used to take samples in or to carry instruments into aerosol layers. For example, Sheridan and others (1992) collected samples of atmospheric particles from the Pinatubo eruption by releasing balloons from Laramie, Wyoming. Most of the fine particles were H2SO4 droplets. Other larger particles were supermicrometer sulfate particles and composite sulfate/crustal particles. Deshler and others (1992) also used balloons to study the aerosols in the Pinatubo layer. Their study showed that 90% of the SO2 had been converted to H2SO4 aerosol within one month of the eruption. They also measured pressure, temperature, ozone, and particle density.
LIDAR is a ground-based remote sensing method that is used to measure the distribution and amounts of several gases in the atmosphere. NOAA has a fine page that explains LIDAR data.
TOMS image of the Mt. Pinatubo SO2 plume two days after the June 15th eruption The red dot marks the location of the volcano. The concentration of sulfur dioxide is expressed in units of milli-atmosphere centimeters, which gives the total column abundance in the atmospheric column Image created by Gregg Bluth and Arlin Krueger, NASA Goddard Space Flight Center.

The Total Ozone Mapping Spectrometer(TOMS) is used for high resolution mapping and measurements of the ozone layer. TOMS also detects volcanic eruptions and measures the amount of sulfur dioxide released. TOMS was used to measure the sulfur dioxide clouds from three explosive eruptions of the Crater Peak vent of Mount Spurr during the Summer of 1992.

The Advanced Very High Resolution Radiometer (AVHRR) is used to track the aerosol layer produced by eruptions. For example, during the Pinatubo eruption, AVHRR showed that the layer circled the Earth in 21 days and that it had inhomogeneities that persisted for more than two months. The layer covered 42% of the Earth after only two months, over twice the area of El Chichon in the same amount of time. Data gathered allowed an estimate of the net global cooling effect of 0.5 degree C for a period of 2-4 years after the eruption (Stowe and others, 1992). Maps show thickness of aerosol optical products prior to and 20 days after the 1991 eruption of Pinatubo. Photo credit: G.J., Orme, Department of the Army.