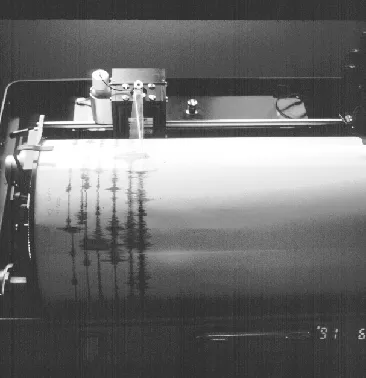
There are lots of signs that are examined, depending on how closely monitored the particular volcano is. Probably the most common type of monitoring is by seismicity. Even one seismometer can tell if there is an increase of seismic activity on a usually seismically-quiet volcano. If you have at least 3 seismometers, and they are strategically placed, you can triangulate on earthquakes to see if they are occurring in a place that indicates perhaps magma movement. By examining the seismic data over a period of time you may be able to determine if the earthquakes are migrating towards the surface (suggesting that magma is also migrating towards the surface since the earthquakes are probably being generated as magma breaks rocks that are in its way).
Another type of data that is used is the study of ground deformation. When magma moves up into the shallow plumbing of a volcano, it takes up space and pushes the surrounding rock outward. This also causes the surface of the volcano to deform. Some points move upward and any two points will move farther apart. By using very accurate leveling and distance-measuring techniques, these surface changes can be measured. Usually the changes are a few mm over a distance of a few hundred meters, but sometimes they are dramatic. For example prior to many eruptions at Kilauea, the summit bulges 1-2 meters upward. In the last few days prior to the big Mt. St. Helens eruption the northern flank was bulging outward at a few meters per day!
Some people like to monitor volcanoes by constantly monitoring gases that come out of fumaroles. Most active volcanoes have fumaroles where volcanic gases escape to the surface. It is relatively easy to monitor the temperatures of these gases, and an anomalous increase in temperature might be a sign that magma has moved closer to the surface. Monitoring the composition of the gases is more difficult to do, and changes in the composition are way more difficult to interpret. Many times just visual changes to fumarole areas are indications of impending activity. If the area of active degassing gets larger, if the plants nearby die suddenly, if the color of any lakes or ponds nearby changes...Many volcanoes have summit lakes through which heat and gases rise to the surface and escape. Many of these lakes have strange colors due to all the dissolved minerals in them, and many of the colored ones change color, pH, temperature, etc. These too, are signs of change below but are often difficult to interpret.
A number of people are studying ways in which to use satellite data to monitor volcanoes. It is possible to obtain thermal images of volcanic areas, and by comparing images on a monthly or bi-weekly basis, increases or decreases in temperatures can be detected. Additionally, some new technologies have allowed for the determination of very accurate topography from satellite data. This technology may someday allow for the remote monitoring of surface deformation associated with sub-surface magma movement. This process is still being developed. It usually takes too long to get satellite data processed for this technique to be useful in a rapidly-escalating crisis so it would be used over the long term, in the years to months prior to an eruption rather than the hours prior.
Image: Seismograph in action at Pinatubo response. A glance at the seismogram wrapped around the drum gives experienced volcanologists a quick appreciation of the current level of seismic activity at the volcano. Photo by R.P. Hoblitt.